Experiment
Congress Bill Flow
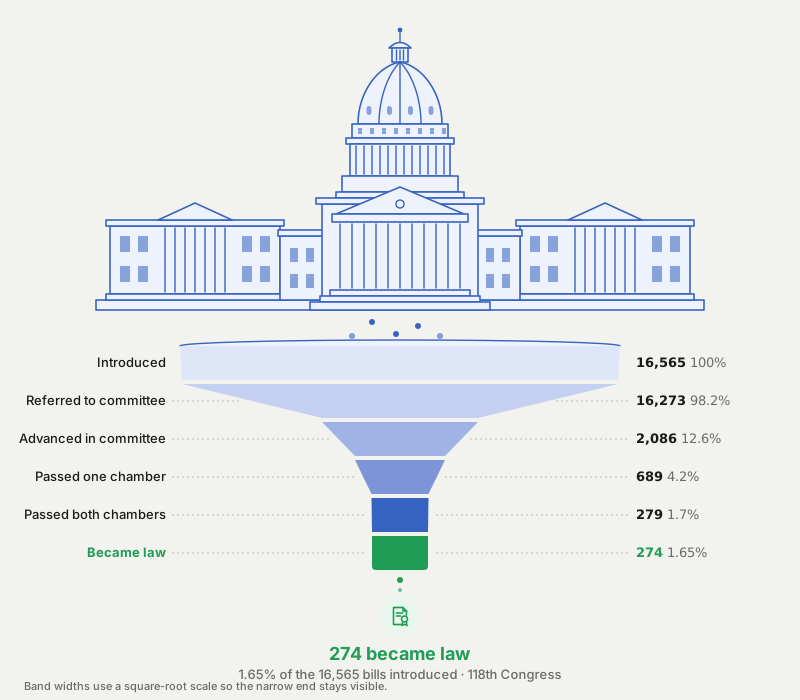
Where the bills introduced in the 118th Congress actually ended up — from introduction to law, with every die-off along the way, in one interactive Sankey diagram.
What it shows
Every bill introduced, narrowed stage by stage down to the ones that were actually signed into law.
Click any stage for its exact count, share of all introduced bills, and what qualifies for it.
Built from the official congress.gov API, fetched at build time — not scraped, not estimated.
A histogram of days from introduction to a bill's last recorded action, color-coded by how it ended.
Which states' delegations sponsored the 274 enacted laws, plus a breakdown by policy area and party.
Insights from the data
1.65% of introduced bills became law
Of the 16,565 bills introduced in the 118th Congress (2023–2024) — every HR, S, HJRES, and SJRES, the types that can actually become law — only 274 were signed into law. Five more passed both chambers and reached the President's desk, only to be vetoed.
85.6% of bills never leave committee
14,187 bills — the large majority of everything introduced — were referred to a committee and, as far as their public record shows, never heard from again: no hearing, no markup, no vote. The committee referral is where most bills quietly end, not the floor.
Notes from the experiment
- Scope is limited to HR, S, HJRES, and SJRES — the bill types that can actually become law. Simple and concurrent resolutions (HRES, SRES, HCONRES, SCONRES) follow a different, chamber-only process with no presidential step, so they're excluded.
- Each bill is classified by the furthest stage its single most recent recorded action reaches. The congress.gov bulk endpoint doesn't include a bill's full action history without a separate call per bill, so this is an approximation built from one signal, not a full parse of every bill's timeline.
- "Passed both chambers" and "Presented to President" show tiny or zero counts — that's real, not a bug. Once the second chamber passes a bill, it's typically enrolled and presented to the President within days, which immediately supersedes that action as the bill's "latest" one. For a completed Congress, almost nothing is left sitting in that in-between window.
- 410 House bills passed the House and then got no further recorded Senate action, against essentially none going the other direction. That asymmetry is a real pattern from the 118th Congress's divided government, not a data artifact — the House majority passed a lot of bills the Senate simply never took up.
- A small number of bills (well under 1%) have a most-recent action that's purely administrative, like a sponsorship reassignment, and so read as less advanced than they actually are.
- The "time to resolution" view shows most committee deaths happen fast: 12,796 of the 14,187 bills that died in committee had their last recorded action within 30 days of introduction. A bill that never gets picked up usually stops moving almost immediately — it doesn't linger for two years before quietly dying.
- The single largest policy area among the 274 enacted laws is "Government Operations and Politics" (98 laws, 36%) — driven mostly by post office renamings and similar ceremonial designations, not major legislation. Worth knowing before reading too much into a raw "laws enacted" count.
- That same policy area also has the highest enactment rate of any category — 7.6% of the 1,286 Government Operations and Politics bills introduced became law, versus 1.65% overall. The two facts are connected: ceremonial namings are uncontroversial and pass easily, which pulls the whole category's rate up. By contrast, Agriculture and Food (0.12%), Labor and Employment (0.20%), and International Affairs (0.28%) were the hardest categories to get enacted, each with hundreds of bills introduced and only a handful becoming law.
- Republican-sponsored bills had a modestly higher enactment rate than Democrat-sponsored ones in the 118th Congress (1.96% vs. 1.34%) — consistent with the House holding a Republican majority that controlled the floor agenda, not a claim about either party's legislation being better.
- The impact map shows which state's delegation sponsored each enacted law, not who it actually affects — congress.gov has no field for real-world geographic impact, and most federal law applies nationwide regardless of the sponsor's home state. Dollar figures are left out entirely: neither bill titles nor summaries reliably state a funding amount, so showing one would mean guessing.
- Each enacted law is also classified "ceremonial/commemorative" or "substantive" — a title-pattern heuristic (facility and route namings, Congressional Gold Medals, commemorative coins and sites count as ceremonial; everything else, including narrow or minor bills, defaults to substantive). It's a factual classification of legislative type, not a judgment about whether a law was good policy — click any state or policy area in the Impact view for the breakdown.
- The scatterplot under "Time to resolution" plots every bill individually by introduction date and days-to-resolution. Its upper edge is a straight diagonal for a structural reason, not a pattern in the data: a bill introduced late in the Congress simply can't have a long duration before the Congress ends.
- The Pareto chart ranks time windows by bill volume rather than chronological order, so its x-axis is a rank (#1, #2, …), not a date — the exact day range for any bar is in its tooltip and its click-for-detail.
- Data source: the congress.gov API, fetched at build time and baked into a static JSON file. Nothing calls the API live from your browser.
Related work
Experiment
Florida Politics
An interactive map showing how political control shifted across Florida counties over time.
View experiment
Experiment
Where Now?
A random food and trip generator for the Lisbon area. Built for the moment when indecision wins.
View experiment