Observing how systems actually behave.
Observe. Test. Learn. In public.

Experiment
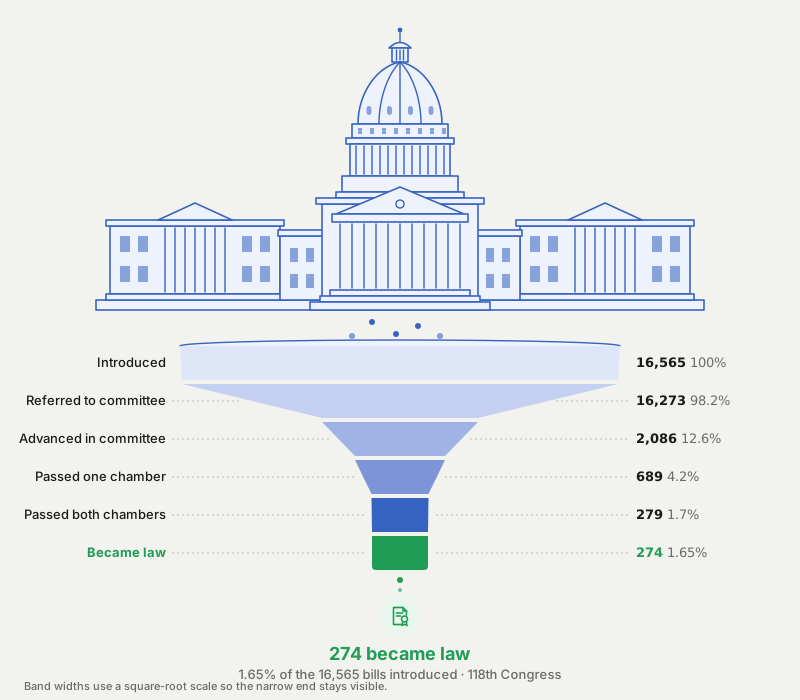
Congress Bill Flow
Where the 16,565 bills introduced in the 118th Congress actually ended up — built from the congress.gov API, not guessed at.
-
Bill flow
A Sankey diagram with every die-off branch — only 1.65% of introduced bills became law.
-
Time to resolution
A zoomable scatterplot and Pareto chart of how long bills actually took to resolve.
-
Impact map
Enacted laws by sponsoring state, policy area, and party — with real enactment rates.
-
No invented numbers
Dollar figures and geographic "impact" are left out where the data can't actually support them.
Experiments
View all experiments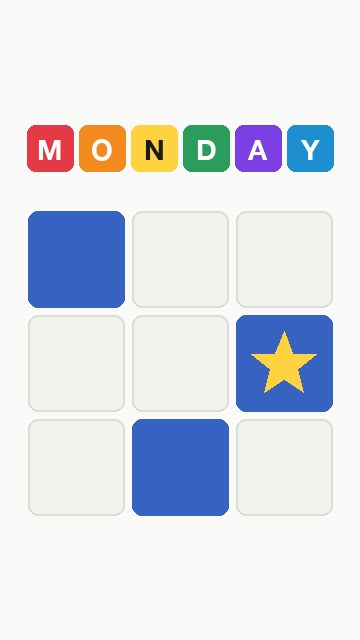
Experiment
Case of the Mondays
A one minute game about where work gets stuck. Pick three, name your biggest headache, and compare Mondays with a colleague.
Play it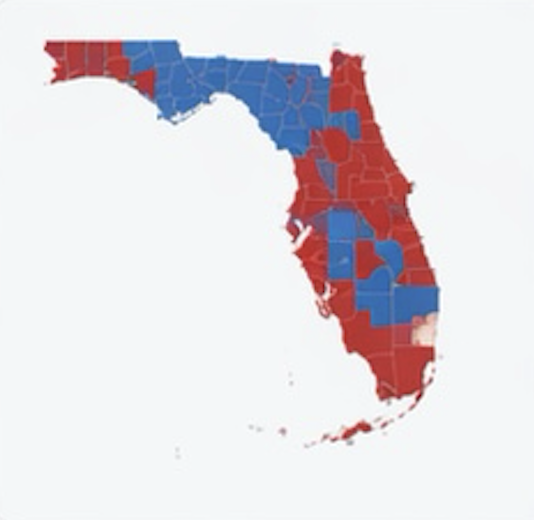
Experiment
Florida Politics
An interactive map revealing how political control shifts across counties over time, based on real election data.
View experimentProjects
View all projects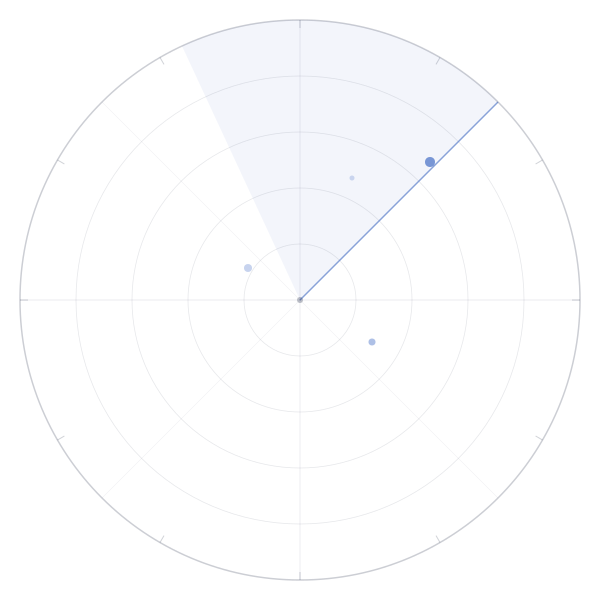
Project
Work Radar
A system for tracking opportunities, scoring fit, and managing the full job search process in one place.
View projectSome of this work is informed by or turns into real-world applications and solutions at Evolving Orgs. ↗